A recent report by the United Nations Children’s Emergency Fund (UNICEF), Generation 2030 Africa 2.0 (2017), refers to the vast number of Africa’s children, or the so-called “youth bulge”, as a potential “demographic dividend” for the continent. But which of the continent’s countries are ready to take advantage of this “dividend”? And which have the correct conditions in place to turn the bulge into a dividend?
The UNICEF report indicates that getting Africa’s large proportion of young people work to a country’s advantage requires certain conditions. These include the presence of essential services, skills enhancement measures, as well as measures that enhance social protection. These various measures can be represented in a simple model, as in Figure 1, below.
Figure 1: Key policy actions for Generation 2030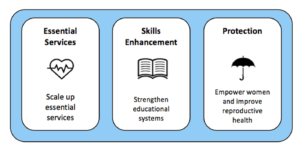
Source: Adapted from Key Policy Actions for Generation 2030, UNICEF, 2017
Essential services include health and social welfare systems. Skills enhancement includes the provision of good quality educational systems, and social protection involves measures to protect women and children from abuse, discrimination and violence.
This simple model provides a way of conceptualising the readiness of countries to deal positively with the youth demographic. The more countries are able to invest in these requirements, the greater the probability that the continent’s large proportion of young people will be an economic asset.
It is therefore possible, using this model, to gain some insight into countries’ current readiness for dealing with the youth demographic, and to identify areas in which they might improve. This paper sets out to do so; that is, to apply the model to current African data to assess the continent’s readiness for meeting this challenge.
There are several challenges to doing so. Firstly, the paucity of African data means that validity will be in question (that is, that the scarcity of data means that we will have to use variables that approximate the model components in only the broadest terms). Secondly, not all African countries and regions are represented. This article focuses only on sub-Saharan Africa, and within that, only the countries for which we could obtain complete data.
This aside, the analysis provides a useful starting point for discussion on the issue that is based, to an extent, on real-world data.
Methodology
The model provides three overarching components that together represent the likelihood of a country reaping a benefit from the youth demographic. These include essential services, skills enhancement, and social protection. In our analysis, we approximated these components in the following way.
Essential services: for this component, we used the World Bank Indicators “current health expenditure per capita, PPP (current international $)” and “unemployment”. The World Bank describes current health expenditure as “current expenditures on health per capita expressed in international dollars at purchasing power parity (PPP)”. Unemployment is described as “the share of the labour force that is without work but is available for and seeking employment”.
Skills enhancement: as a proxy for skills enhancement, we made use of the World Bank Indicators “government expenditure on education, total (% of GDP)”, defined as the “general government expenditure on education (current, capital, and transfers) expressed as a percentage of GDP. It includes expenditure funded by transfers from international sources to government. General government usually refers to local, regional and central governments”.
Social protection was approximated by making use of the World Bank Indicator, “CPIA gender equality rating”. This variable “assesses the extent to which the country has installed institutions and programmes to enforce laws and policies that promote equal access for men and women in education, health, the economy, and protection under law”. Social protection was additionally assessed by the World Bank Indicator, “adults (ages 15+) and children (ages 0-14) newly infected with HIV”, which refers to the “number of adults (ages 15+) and children (ages 0-14) newly infected with HIV”.
It is, of course, possible to question the validity of these variables. How well do they measure the model components? Any claim that they offer a close or complete picture would be misleading. They do, however, offer some indication of youth-readiness of the countries included, and offer some indication of where improvements can be made.
To plot the data, all variables were converted to a percentage of the highest score. In each variable, therefore, one country scored 0% and another 100%, with all other countries scoring between these two extremes. Once again, there are strengths and weaknesses to this approach. While conversion to percentage means that variables are directly comparable, it also means that the range of scores are always 100, which might artificially extend or reduce the differences in the raw data.
The variables of interest were arrayed against the youth population size for each country, which was represented on the y-axis. There was little variation in the size of the youth demographic relative to the overall population (between 18% and 22%) and this might be considered to be uniform across the sample – as the International Labor Organization (ILO) does, for example, with its indicators.
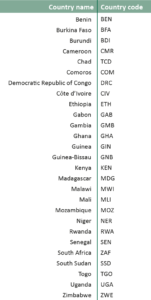
The analysis includes 27 sub-Saharan countries. The high number of countries included is due to the lack of detail in the data; using few, broadly applicable variables means that the data exists in more countries. The list of countries, as well as their codes, is included in Table 1:
Results
Investment in essential services was represented by government investment in health and employment. The spread of health provisions was dominated by South Africa (ZAF), which at 100% is the country spending the most on health per capita, expressed in international dollars at purchasing power parity (PPP). This is in spite of it spending significantly less of its GDP on health than several of the other countries (8% compared to, for example, Zimbabwe’s 10%, Liberia’s 15%, or Sierra Leone’s 18%).
Figure 2: Essential services: Health
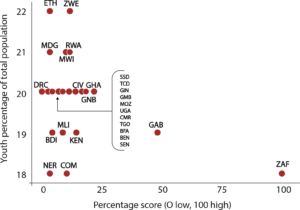
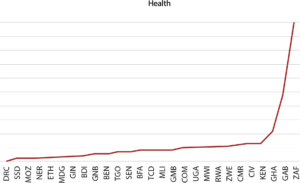
Only Gabon rivals South Africa in this regard. The other countries trail off with significantly lower scores.
Figure 2: Essential services: Health
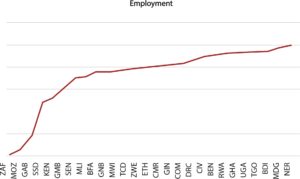
Level of employment represents the other variable measuring the provision of essential services. In this context, South Africa falls way behind other countries, with the average for all the countries included in this study being 7% unemployment. South Africa has the lowest level of employment, with some 24% of the workforce unemployed, while Nigeria has the highest level of employment, with 0.32% of the total employable workforce unemployed.
Figure 4: Essential services: Employment
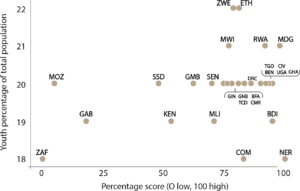
Figure 5: Essential services: Employment
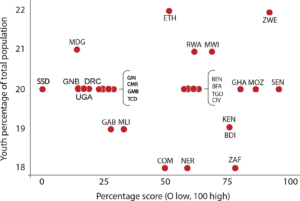
Skills enhancement was represented by the provision of education, more specifically government expenditure on education as a percentage of GDP. The results are represented in Figure 6 below.
Figure 6: Skills enhancement: Education
Overall, all the countries included in this study had similar employment figures, as indicated in Figure 5.
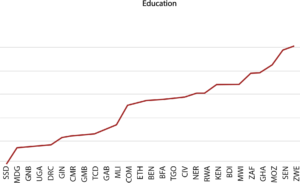
Education represents an area in which there is a large range across the countries, as indicated in Figure 7.
Figure 7: Skills enhancement: Education
The final component of the model was “social protection”. In our analysis, this was represented by gender equality. Once again, this variable displayed a wide range within the country sample.
Figure 8: Protection: Gender equality
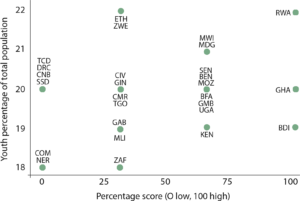
Figure 9 provides an indication of the range of scores across the sample of countries. The staggered results reflect the crude scoring system underlying the measure, with many countries having scored the same as each other.
Figure 9: Protection: Gender equality

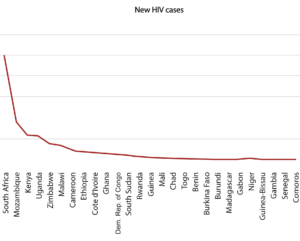
To add to this component, we also included the number of new HIV infections acquired as part of “social protection”. It was felt that new infections might better represent protection than HIV prevalence, as HIV prevalence is affected by historic trends while new infections are not. The results are represented below:
Figure 10: Protection: New HIV infections
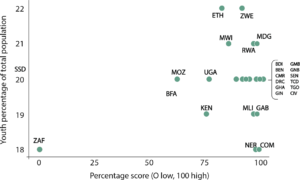
It is evident that new HIV infections occur in significant numbers in only a few countries, with South Africa being by far the most severely affected, as represented by a score of O in Figure 10, which indicates that it is the worst-performing.
Discussion
The findings for each component were combined to provide an overall picture of “readiness” for deriving a dividend from the youth demographic. When combined, a picture emerges in which Ghana fares particularly well, followed by Rwanda, Burundi, and Senegal.
Figure 12: Overall readiness for youth bulge
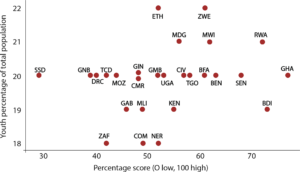
The model encapsulates the need for countries to perform well in all three components if they are to score highly in youth readiness. The message is that an all-round approach to readiness is essential.
Countries that fared very well on some variables but not on others cannot claim readiness based on one or two dimensions. South Africa (ZAF) is a case in point: despite good educational and health investments, the country still fared relatively badly because of high rates of HIV infection.
Key data
ILO. (2018). Key Indicators of the Labour Market 9th edition. International Labor Organization. Retrieved from http://www.ilo.org/ilostat
The World Bank. (2018). World Development Indicators. The World Bank. Retrieved from https://data.worldbank.org/indicator
UNICEF. (2017). Generation 2030 Africa 2.0: Prioritising investments in children to reap the demographic dividend.
Vaughan Dutton is a chartered research psychologist and associate fellow of the British Psychological Society, with 18 years’ social research experience gained at senior levels in commercial, government and academic contexts. He has taught social research methods, social theory and psychological theory at a number of universities in South Africa and the UK. Currently a consultant, he is also completing a doctorate in psychotherapy. He studied research psychology (applied social research) in South Africa, and holds a research doctorate from the University of Oxford.
